
Prior to the weekend series with the Braves, we all know the offense has issues; that was reinforced with the first 3-game sweep of the Birds since last July and the first time they’ve been shut out in a 3-game series since the mid-70s.
So, how do we stack up against everyone else? I’ve taken various offensive stats of the team and compared them to the MLB average and the NL average.
Counting Stats
The Cardinals got hits, but they ranked 14th in the MLB and 6th in the NL.

Even being 6th in the NL, they were 10 below the average; they were 18 back of the MLB average. You’d think with where they ranked, they’d have been closer to the averages.
Home runs are worse for the team. They ranked 25th in the MLB and 11th in the NL.
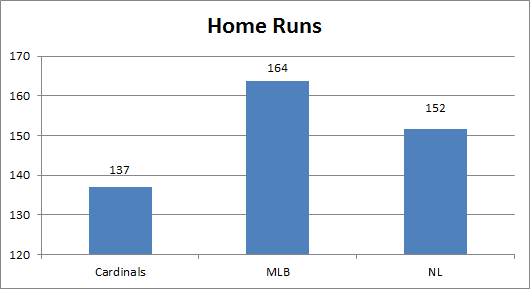
2015 was better for the Cardinals power department, but they were still quite a ways behind the averages. Part of this was due to injuries (Randal Grichuk was 2nd on the team with 17 and he missed quite a bit of time; many expected more from Matt Adams, Matt Holliday, and Yadier Molina who all battled injuries as well).
Matt Carpenter is an interesting case here too; he blew past his career power numbers this season, but sacraficed average to do so (the inverted Allen Craig maybe); this is something I’m going to dig into in the near future.
Runs were another issue compared to the league, both scoring them and driving them in. The team ranked 24th in the MLB in both categories and 11th in the NL in both.

They were very lucky the pitching was as good as it was, since they had a positive 122 run differential. 19 runs below the NL average and 41 behind the average of all teams is pretty bad.
RBIs were just as ugly.

The offense was below average, and fans that watched day in and day out knew this. Seeing the numbers though really just drives this home.
Rate Stats
The rate stats look a little better until you look at Isolated Power; but we’ll end with that. First we’ll look at walk percentage, where the team was 4th in the NL and 7th in all of baseball.

The averages for both the league and NL were close, and the Cardinals were .55% better than the league. This is a bright spot courtesy of Holliday (14.1%) and Carpenter (12.2%).
Strikeout percentage wasn’t as favorable; the team ranked 5th in the NL and 15th in baseball. They were pretty good in their own league, but middle of the pack overall.
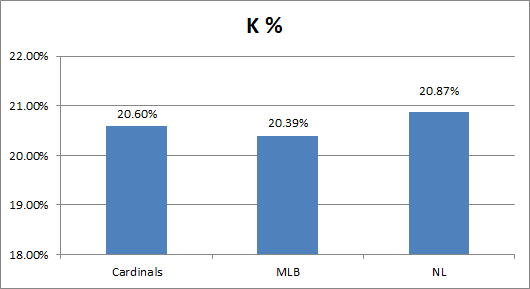
The Cardinals were right between the two averages; they were slightly below the league average (technically above it since they struck out more often than the league as a whole). They were more favorable compared to other NL teams though, which is reflected in their ranking.
The last rate is Isolated Power, which the Cardinals ranked 10th in the NL and 24th in baseball. For those unfamiliar with ISO, it’s slugging minus batting average, which shows the batters raw power by calculating how many extra base hits he gets per at bat.

There wasn’t much of a difference in ISO for the NL; while the Cardinals were only better than 5 teams in the league, they were only .002 behind the league average. It was much different for the league though, as they were in the bottom third and .008 behind the average.
Like I said, the rates were a mixed bag; the Cardinals were good at being patient and taking a free bag, need to work a little on striking out, and have to add some power.
Slash Stats
Slash stats were another mixed bag. We’ll go in typical reporting order, leading off with batting average; the team ranked 6th in the NL and 12 in baseball.

While the rankings were a little better than middle of the road, they just about matched up with the averages. I was a little surprised at this since the team only had Stephen Piscotty as a semi-regular hitting over .300; Jason Heyward was the next closest at .293.
On base percentage was more of the same for rankings, but not compared to the averages. The team matched their batting average ranking in the NL (6th), while they dropped to 13th in all of baseball.

Due to the higher BB%, the Cardinals were above average with OBP by a small margin compared to both the NL and MLB as a whole.
While the OBP had ties to BB%, their slugging percentage tied into their ISO. For slugging, the Cardinals ranked 9th in the NL and 23 in MLB.

While the team was only .003 behind the NL average, they were .011 behind all of baseball. We know the team didn’t hit many homers and their ISO was below average; this just confirms it all.
After seeing OBP and SLG, I assumed they’d probably be right in the middle for On Base plus Slugging; they ranked 8th in the NL and 19th in baseball.

Due to their better OBP, they were above average in the NL; it wasn’t enough though to push them to an above average team in the MLB, being .006 back of the average.
Base Path Stats
One thing the Cardinals wanted to do more in 2015 was run; while they did see an increase in stolen bases, they were still a sub-par team at it. They ranked 21st in stolen bases, 18th in caught stealing, and 22nd in stolen base attempts.

The team was 15 stolen bases below the MLB average and 19 below the NL average. Then they were caught stealing 3 more times than both averages. Heyward was a good example of what the Cardinals should be doing; he went 23 for 26 on the season. On the flip side was Kolten Wong (15 for 23) and Peter Bourjos (5 for 13); Wong is still young and developing his base path instincts, but Bourjos has amazing speed and has been around a little bit longer.
Below Average It Is
So most of the offensive numbers have supported that the Cardinals owned a below average offense; as mentioned earlier, it was a miracle that the pitching was as good as it was, or the season would have been more like that last Atlanta series.
I’ll be back in a few days to look at pitching in this same exercise.
Eugene is also a writer and podcaster for Nyrdcast, where he talks pop culture; you can also find him on Twitter or email him here.