
The Cardinal offensive problems this year have been well documented; they didn’t score many runs and struggled in almost all facets of hitting. I have placed much of the blame on hitting coach John Mabry; he’s the guy that is supposed to work with the hitters and get them on track (there is also blame for Mike Matheny and his usage of players, along with GM John Mozeliak who constructs the roster).
Is Mabry the culprit? Looking at the last 10 years of offensive numbers, there are definitely some trends. Since 2006, the team has used Hal McRae (2006-2009), Mark McGwire (2010-2012), and Mabry (2013-2015) as hitting coaches. I used the team numbers on the dashboard at FanGraphs for this series; I could have expanded to include other numbers, but I felt like I had a good number that encompassed the offense.
Lets start with scoring; runs were limited for the Cardinals during the season. Sure they had some games where they crossed the plate 6 or 7 times, but those games were rare; the team scored 5 or more runs in a third of their games and averaged 3.99 runs per game.
Here is the last 10 years of runs for the team:

This past season, they ranked 9th out of 10, with the bottom spot belonging to the 2014 team. It’s interesting to note that the highest scoring team in this period was the 2013 team, the first under Mabry; that was the team with the unsustainable hitting with runners in scoring position. The 647 runs this year was 78 runs below the next lowest total.
RBIs are pretty much the same:

Like runs, RBIs were second lowest, with the fewest coming the previous season; the top was 2013 again, but tied with 2006. I noticed that pretty much the decline or rise in runs showed correlation to RBIs, which should be expected (the outlier was 2009-2010, where runs decreased while RBIs increased).
Home runs continues the downward trends for the most part:

Mabry’s 3 years as hitting coach has seen the lowest 3 totals of that period. There are multiple reasons for that; Matt Holliday‘s power is declining and Matt Adams hasn’t show power since he’s been up full time (we also lost that Albert Pujols guy after 2011).
Going in a different direction for the last stat, we’ll look at stolen bases and caught stealing. The Cardinals have not been much of a running team under Tony LaRussa and Matheny, so the trends might be harder to find.

2015 was pretty much right in the middle of the 10 years; they ranked 5th, but the highest since 2012.
They have been pretty consistent in getting caught, with 2013 being the low (to coincide with their lowest total of successes). Here is their success rate:
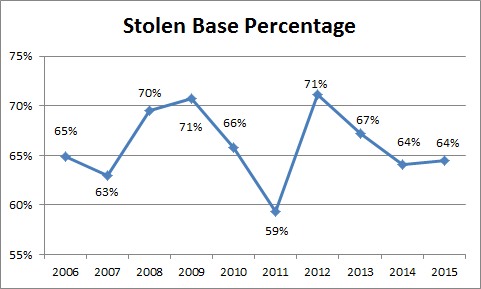
Their success percentage was tied for 7th in the period.
Comparing the Coaches
Now that we’ve seen what has happened over the last 10 years, lets break it down by coach.
As mentioned, McRae had the first 4 years of this study, and based off the numbers he was fairly successful.
His team averaged 165 homers per season, scoring 754 runs and driving in 718. They averaged 66 stolen bases while getting caught 32 times (successful 67% of the time).
His teams lead in homers and RBIs, while tied for the lead in runs and second in stolen bases (he led SB success percentage).
He was dismissed after 2009 (which was highly questionable at the time) so LaRussa could get McGwire back into the game. McGwire had a pretty good 3 years as well.
His teams had 157 homers, 754 runs, 716 RBIs, and 76 stolen bases to 39 times being caught (66% success). That placed him as first for stolen bases (second in success), tied for first in runs, and second in RBIs and homers. Those are solid numbers.
McGwire left the Cardinals to coach closer at home with the Dodgers; Matheny brought in his close friend Mabry to take over. And things haven’t gone quite as well.
His teams averaged 122 homers, 683 runs, 650 RBIs, and 57 stolen bases with 31 times being caught (65% success). He’s bottom of all the categories.
At this point, I’d say McRae and McGwire were neck and neck, with Mabry the clear 3rd. Next time I’ll look at the slash stats.
Eugene is also a writer and podcaster for Nyrdcast, where he talks pop culture; you can also find him on Twitter or email him here.